I have had a bad week trying to do some bar-graph using Tikz. There are a couple of solutions around. I wanted something simple, without too much tweaking since I’m not that good at Tikz. I recently started playing with it and unfortunately I don’t have a rigid learning plan with it. Anyways… here is what i figured out:
This solution uses 3D-scatter plots and modifies the marker in order to make the cubes. I tried simple version of it without all the fancy code around it. Something really funny happens to the end result, If you look from different angles (in 2D), it looks just fine. but once you turn the graph to 3D it goes off the balance. Here is how it looks:
I honestly don’t have a clue why this happens. In the original post also there is no fully automatic solution as well.
Then there is matlab2tikz which i decided that I’m not going to touch since its not tikz.
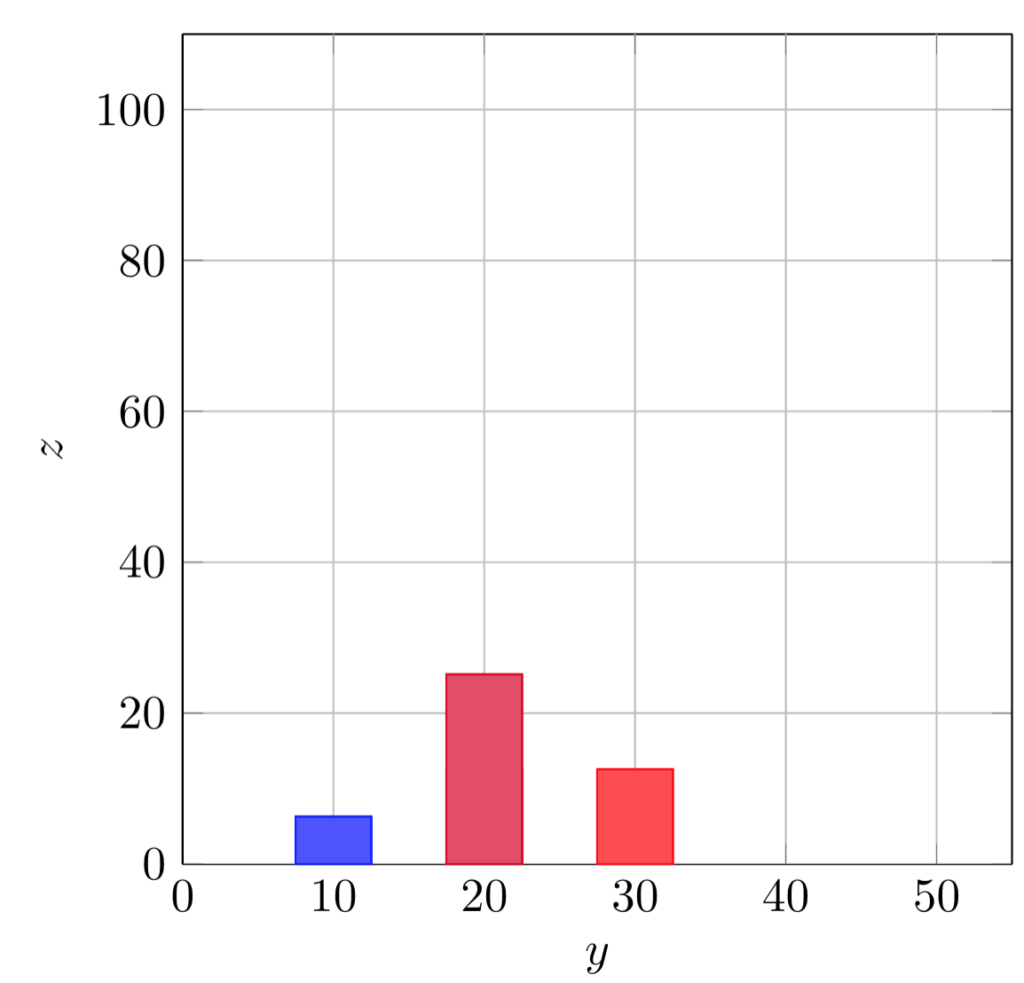
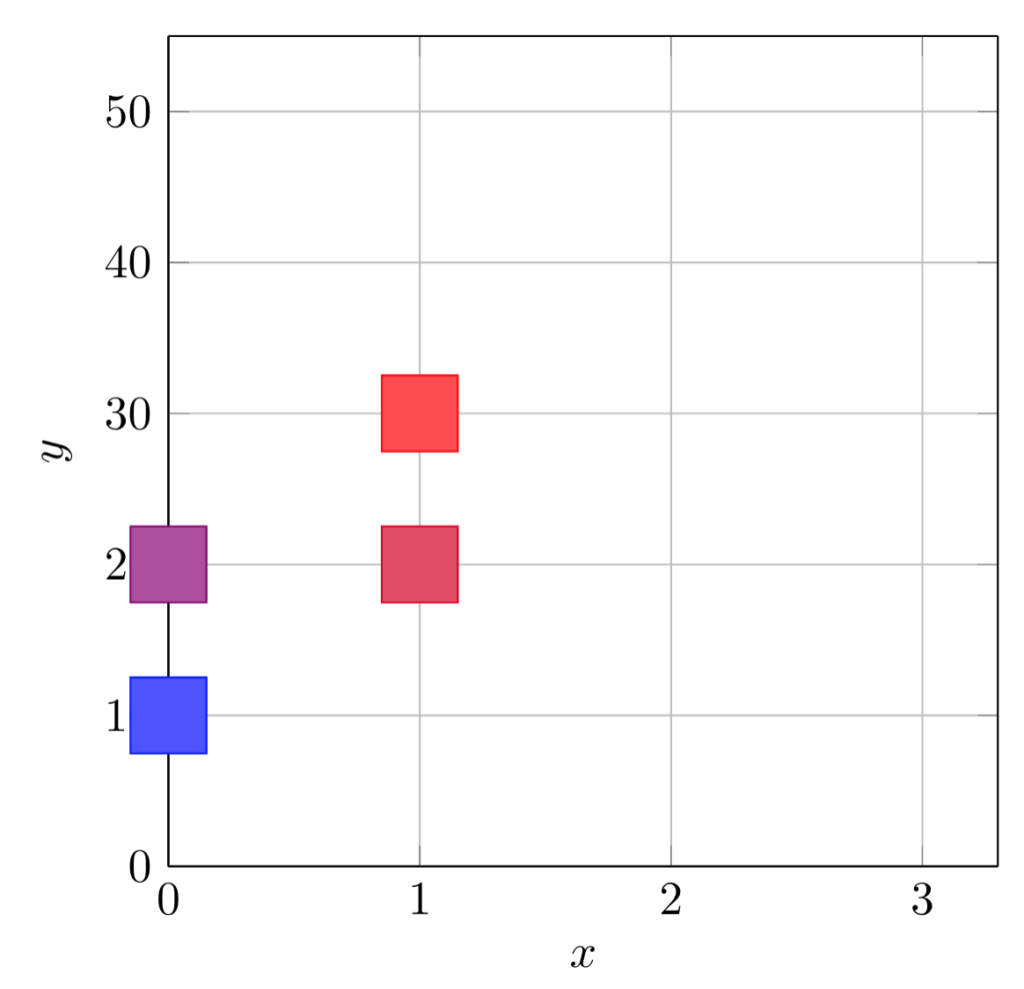
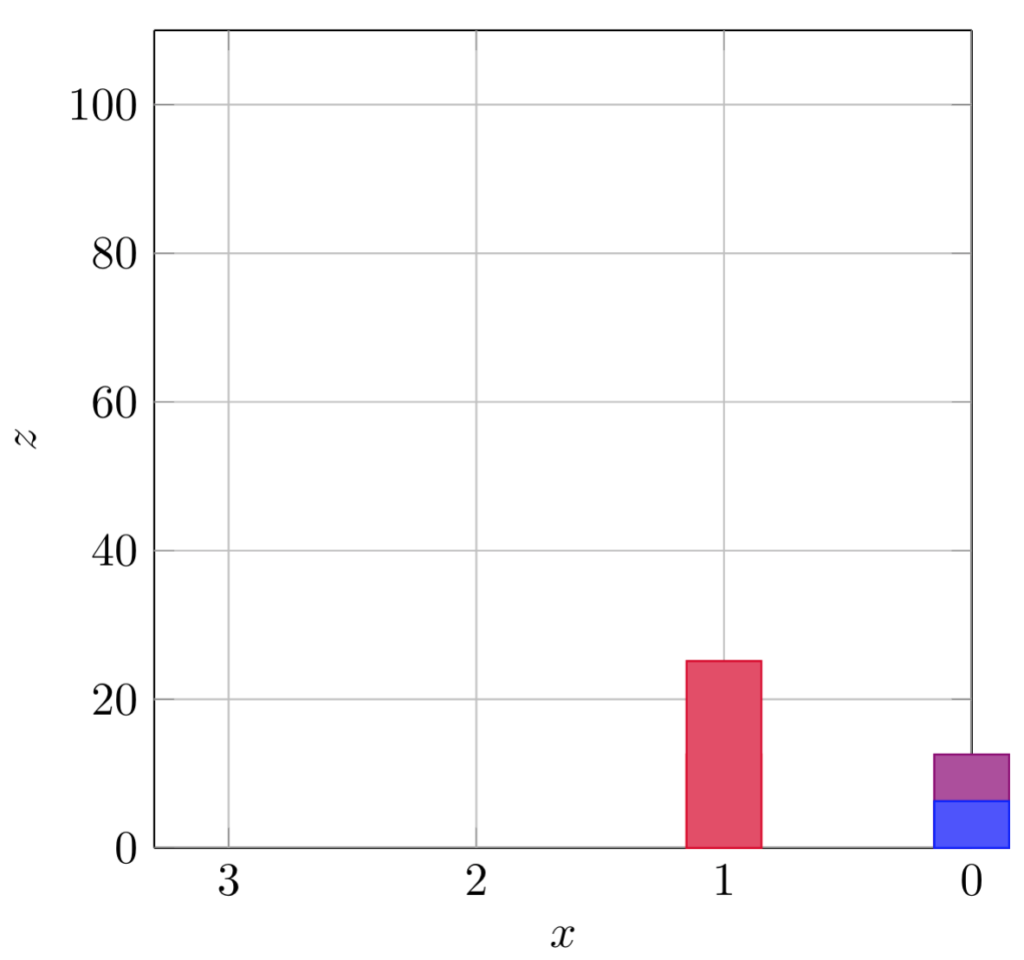
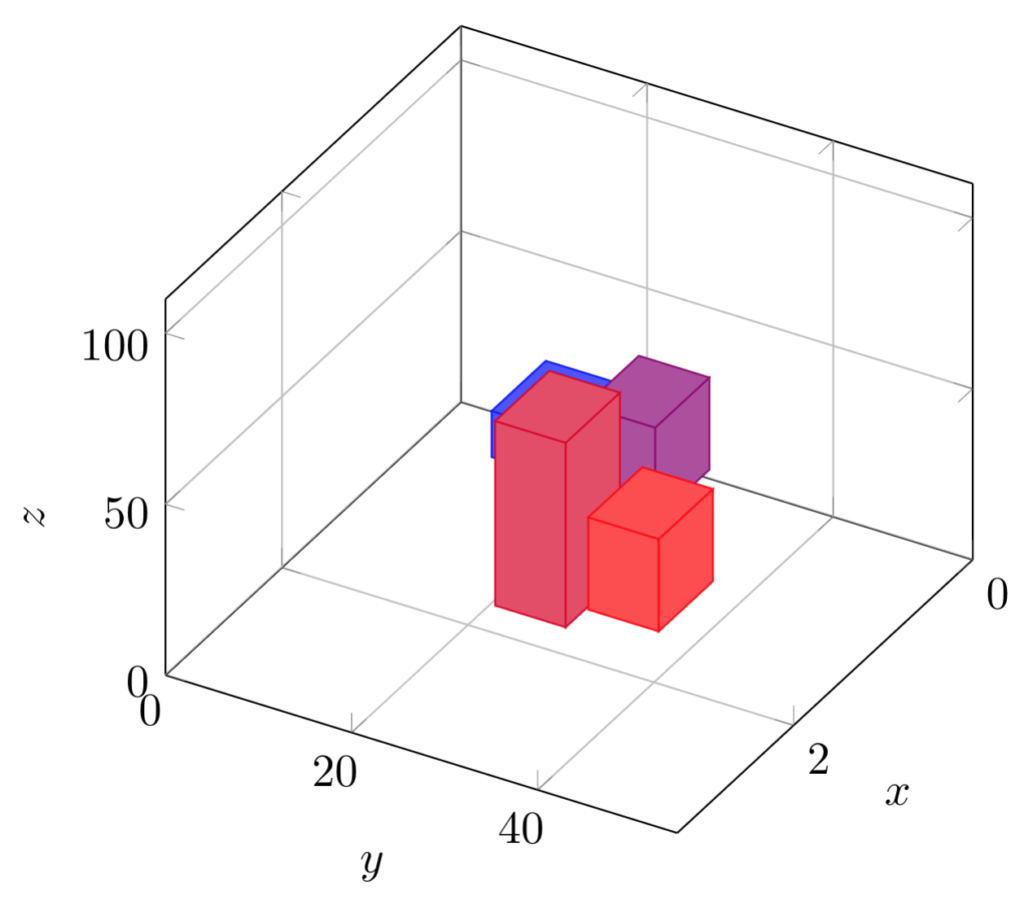
The last one i stumbled upon is to use \addplot3 and make some boxes manually (for example see this). I thought I am not going to draw the entire thing by hand so i added csvsimple to it to read from another file and draw. The drawback here is that the data has to be sorted row by row. you can see it here. It looks something like this:
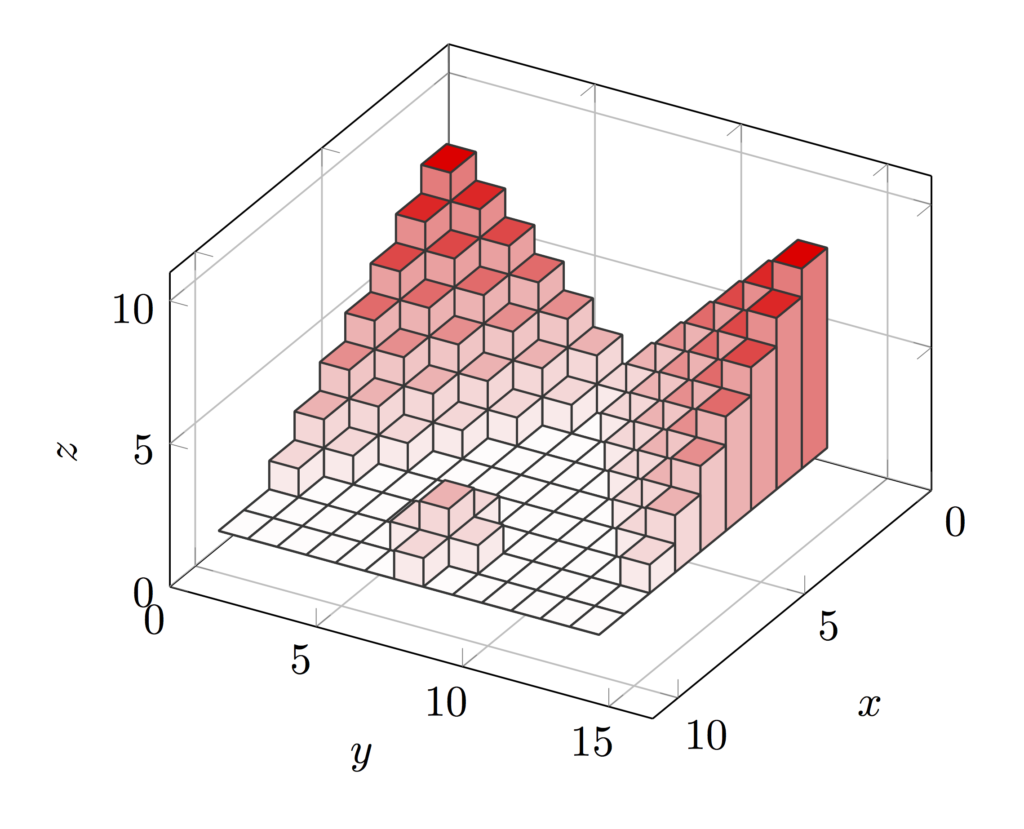
I’m not happy with the end result. It makes too many plots… but I don’t know any better option yet.