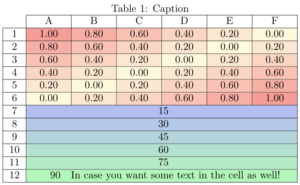
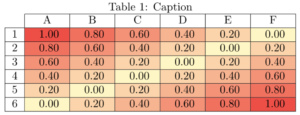
I was recently working on this paper where we had this large tables filled with numbers. I usually don’t get a feeling from this and need some visual aid in order to comprehend what is actually happening. One of way is to implement the heat-map background coloring. this made me (and hopefully the readers in the future) to see the patterns much more clearly.
I began with just calculating the values for the cell color but its really painful and against all my rules… so I started searching… After a bit of search i found this solution. To be honest it’s pretty neat (for its own sake), however there are a couple of problems with it; for starter, it affects an entire column, if you want to avoid it you should probably use multicolumn with 1 column, which is just too verbose. Secondly, it is adding a box in the cell, which i’m not completely onboard with the idea. specially since you have to change the cell border etc for the table to fit things together.
I thought it would be nice if you can just call a function similar to what you would do with \cellcolor along with the value and it would do the job for you. So here is the solution i came up with (i.e. \gradient{cell_val} function). And here is how it looks:
Update [Jan 10 2019]: The issue with this solution is that you have to redefine the colors and min-max values. and what if you want to have a table that is part this and part another gradient colormap? or what if you want to do everything locally just for a few cells? So i made this other function \gradientcell{cell_val}{min_val}{max_val}{colorlow}{colorhigh}{opacity}< (see here again!). However, as you can see it is a long command and i wouldn’t recommend using it too often. Also i moved everything in a package and also added some checks for defensive programming’s sake. It can look something like this: