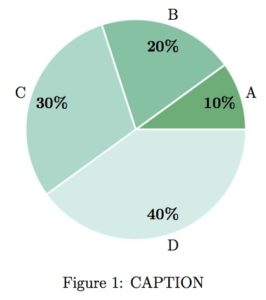
 I made a customizable Pie-Chart generator in LaTeX for a paper i was writing based on this example. With this one, you can choose the color for each portion. Here is how it looks:
You need the following packages in your document preamble:
\usepackage{tikz}
\usepackage{pgfplots}
\usetikzlibrary{calc}
Bellow is the LaTeX code for chart. I marked the parts you need to edit. For each slice you need a tuple such as 10/A/41ae76 the first value is the percentage of the portion, the second value is the tag and the last is the hex value for the portion’s color. You can add or remove tuples from the list.
BTW, I used colorbrewer2.org for choosing the colors. In my opinion, it’s fantastic and has improved dramatically my visualizations’ quality.
———–
\definecolor{border}{HTML}{f7fcfd}   %Set the portion's border color.
\newcommand{\BorderWidth}{0.5}   %Set the portion's border width.
\newcommand{\radius}{3}   %Set the Pie's radius.
\begin{figure}[!t]
\centering
\resizebox{0.5\textwidth}{!}{   %fix the size of the pie for your document
\begin{tikzpicture}
\newcounter{a}
\newcounter{b}
\foreach \x/\name/\color in {10/A/41ae76,20/B/66c2a4,30/C/99d8c9,40/D/ccece6}   % change the tuples!
{
\definecolor{color}{HTML}{\color}
\setcounter{a}{\value{b}}
\addtocounter{b}{\x}
\coordinate (target_1) at ({\radius*cos(\thea/100*360)},{\radius*sin(\thea/100*360)});
\filldraw[line width=\BorderWidth mm, draw=border,fill opacity=1,fill=color] (0,0) -- (target_1) arc ({\thea/100*360}: {\theb/100*360} : \radius cm) -- cycle;
\coordinate (target_2) at ({(0.8*\radius)*cos((\theb+\thea)/200*360)},{(0.8*\radius)*sin((\theb+\thea)/200*360)});
\node at (target_2) {\textbf{\x \%}};
\coordinate (target_2) at ({(1.1*\radius)*cos((\theb+\thea)/200*360)},{(1.1*\radius)*sin((\theb+\thea)/200*360)});
\node at (target_2) {\name};
}
\end{tikzpicture}}
\caption{CAPTION}
\label{LABLE}
\end{figure}
Now the problem is that if the labels become long, the chart would look really bad. So you can start bending the text using Tikz decoration library. These decorations can be used with \path . However, the text under the chart will look upside down which is not really nice. In order to fix it, you can check if the chart slice falls in the bottom and flip it using decorations reverse path.
So all we need in the preamble is the following:
\usetikzlibrary{decorations.text}
\usepackage{ifthen}
and the code would look like this:
\definecolor{border}{HTML}{f7fcfd}
\newcommand{\BorderWidth}{0.5}
\newcommand{\radius}{3}
\newcommand{\InsideTextRadius}{2.5}
\begin{figure}[!t]
\centering
\resizebox{0.5\textwidth}{!}{
\begin{tikzpicture}
\newcounter{a}
\newcounter{b}
\foreach \x/\name/\color in {10/Tag1/41ae76,20/Longer Tag2/66c2a4,30/long long long Tag3/99d8c9,40/even longer longer longer Tag4/ccece6}
{
\definecolor{color}{HTML}{\color}
\setcounter{a}{\value{b}}
\addtocounter{b}{\x}
\coordinate (target_1) at ({\radius*cos(\thea/100*360)},{\radius*sin(\thea/100*360)});
\coordinate (target_2) at ({\InsideTextRadius*cos(\thea/100*360)},{\InsideTextRadius*sin(\thea/100*360)});
\filldraw[line width=\BorderWidth mm, draw=border,fill opacity=1,fill=color] (0,0) -- (target_1) arc ({\thea/100*360}: {\theb/100*360} : \radius cm) -- cycle;
\ifthenelse{\thea>50}{\path [decoration={text along path,
text={|\textbf|\x{$\%$}},
text align = {align = center},
raise = -1.1ex},
decorate]
(target_2) arc({\thea/100*360}: {\theb/100*360} : \InsideTextRadius cm);}
{\path [decoration={text along path,
text={|\textbf|\x{$\%$}},
text align = {align = center},
reverse path,
raise = 0ex},
decorate]
(target_2) arc({\thea/100*360}: {\theb/100*360} : \InsideTextRadius cm)};
\ifthenelse{\thea>50}{\path [decoration={text along path,
text={\name},
text align = {align = center},
raise = -2ex},
decorate]
(target_1) arc({\thea/100*360}: {\theb/100*360} : \radius cm)}
{\path [decoration={text along path,
text={\name},
text align = {align = center},
reverse path,
raise = 1.2ex},
decorate]
(target_1) arc({\thea/100*360}: {\theb/100*360} : \radius cm)};
}
\end{tikzpicture}}
\caption{CAPTION}
\label{LABLE}
\end{figure}
And the resulting graph would look like this:
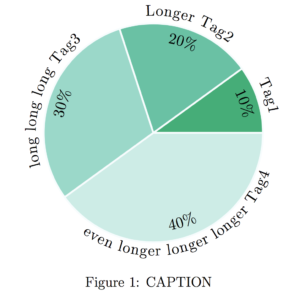
Here is a link to a the overleaf document for the complete solution. I think at this point I dont want to change it too much.